
HEART RATE SENSOR / PERSONAL PROJECT
Listening to my heart
Living with SVT made checking my pulse part of my day. I wanted another way, so I started building a fingertip heart-rate sensor.
A personal hardware experiment, from optical sensing to an Arduino connection.
- Role
- Personal design and hardware prototyping.
- Collaboration
- Not documented in my project record.
- Period
- Dates not recorded.
- Scope
- Optical sensing, circuit design and an Arduino-connected prototype.
TL;DR / Overview
- Problem
- Living with SVT meant repeated manual pulse checks. I explored a fingertip sensor as an alternative.
- Role
- I explored optical sensing and signal conditioning, designed circuits and layouts, and built breadboard and Arduino-connected prototypes.
- Surfaces
- Fingertip optical sensor, signal-conditioning circuit, EAGLE schematic and PCB layout, breadboard test setup and a hand-built board.
- Reach
- Personal prototype; no documented deployment or participant study.
- Result
- Reflected-light sensing progressed to assembled hardware and a fingertip attachment connected to an Arduino.
- Status
- Personal hardware prototype, not a clinically validated monitor.
01 / THE PERSONAL QUESTION
It began with
my own pulse.
I had SVT, supraventricular tachycardia, and counted my pulse at my carotid every few hours.
The Fitbits available then did not offer the reliability I wanted. I explored an alternative to repeated manual checks.
A small thing I could wear and forget.
The idea was a fingertip sensor that logged my pulse and returned the day’s minimum, maximum and average readings.
Here is the hardware exploration behind that ambition: sensing, circuit, breadboard, board layout and physical prototype.
02 / FINDING A SIGNAL
Start with light.
Look for the change.
Before there could be a useful reading, there had to be a signal to count. I explored an optical sensor at the fingertip.
Two components, side by side.
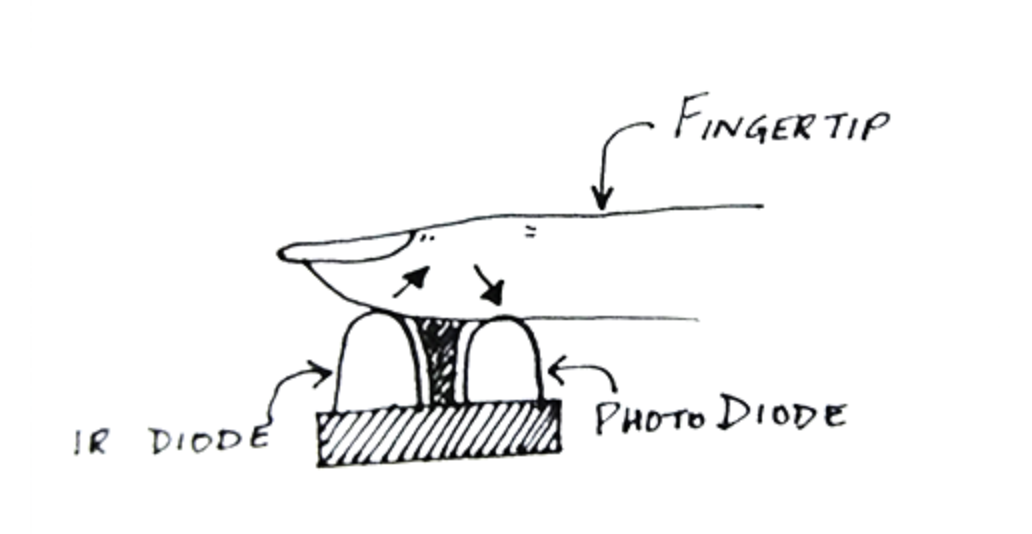
An infrared LED sends light into the fingertip. A photodiode beside it picks up some of the reflected light.
As blood volume changes with each heartbeat, the amount of reflected light changes too. The circuit was intended to turn that small variation into a pulse the microcontroller could count.
In my sketch, the finger rests over both emitter and receiver.
03 / SHAPING THE SIGNAL
The small signal
needed some help.
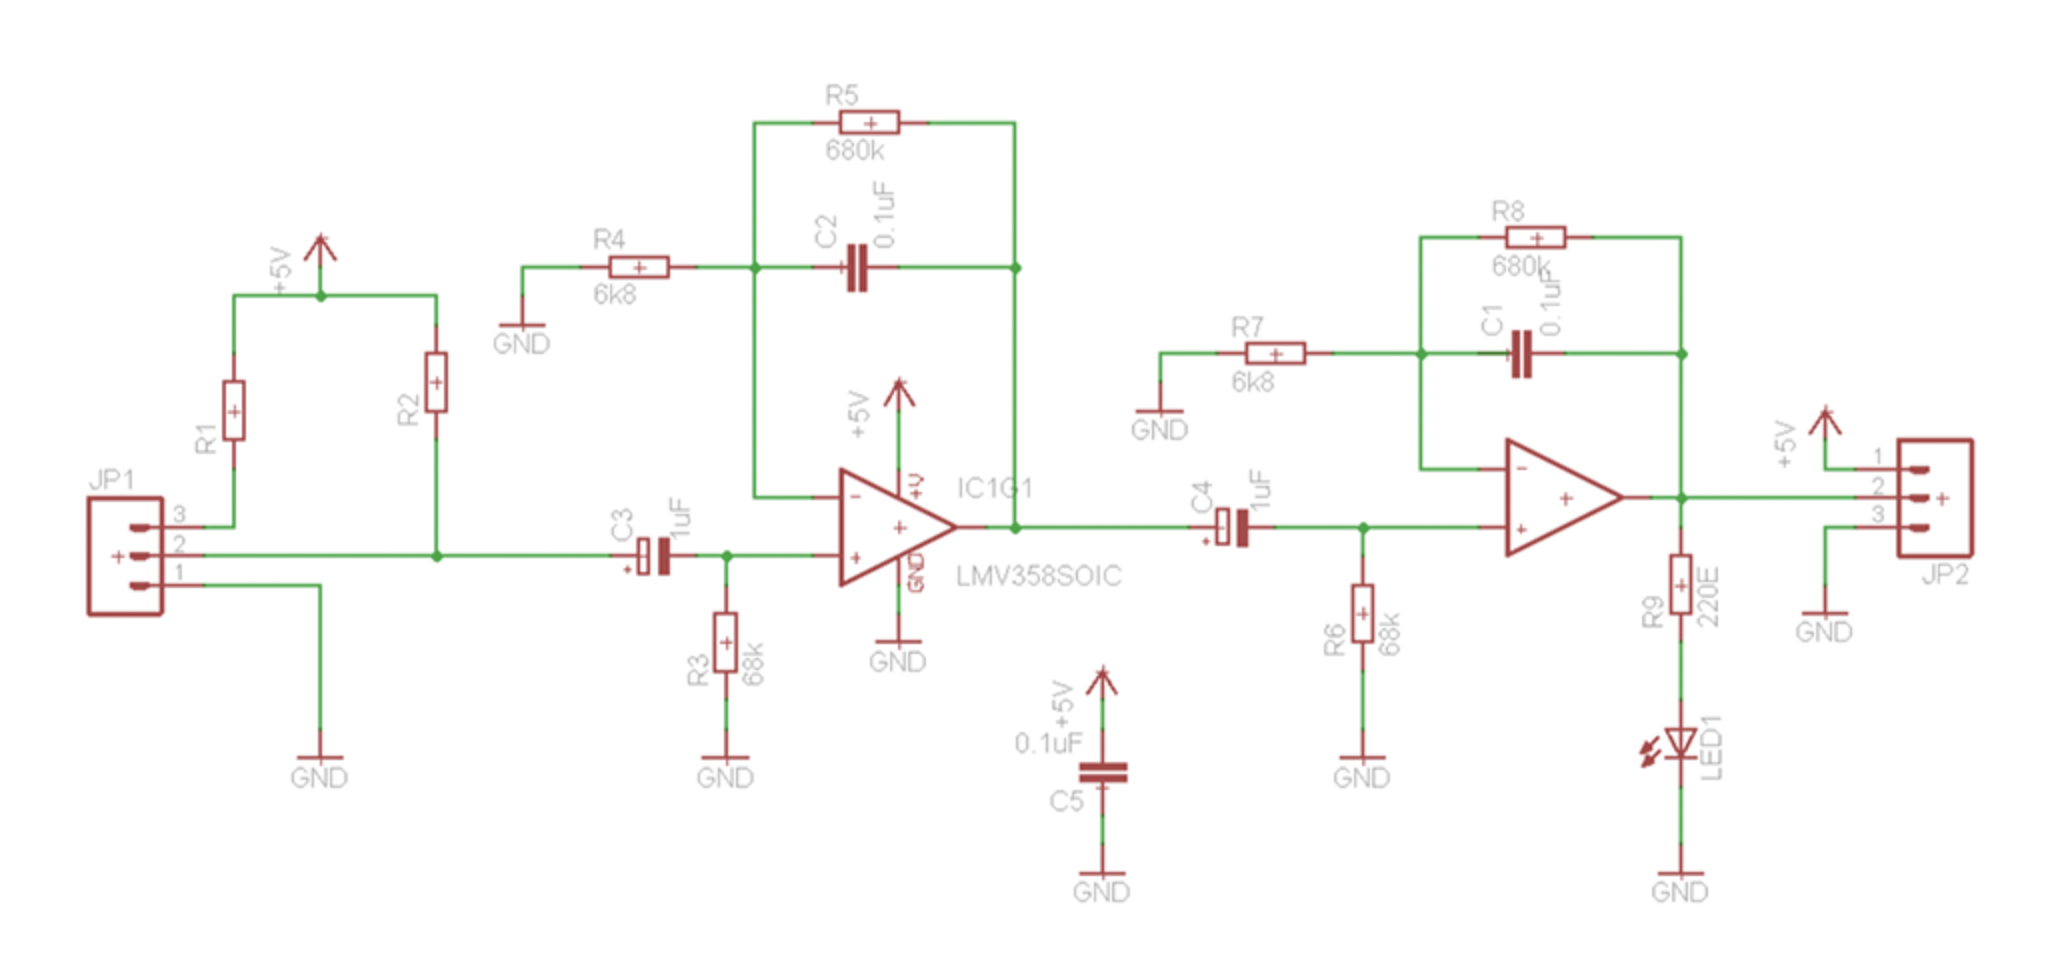
I worked through the filtering and amplification between a change in reflected light and a countable output.
KEEP THE CHANGING PART
Separate the pulse from the baseline.
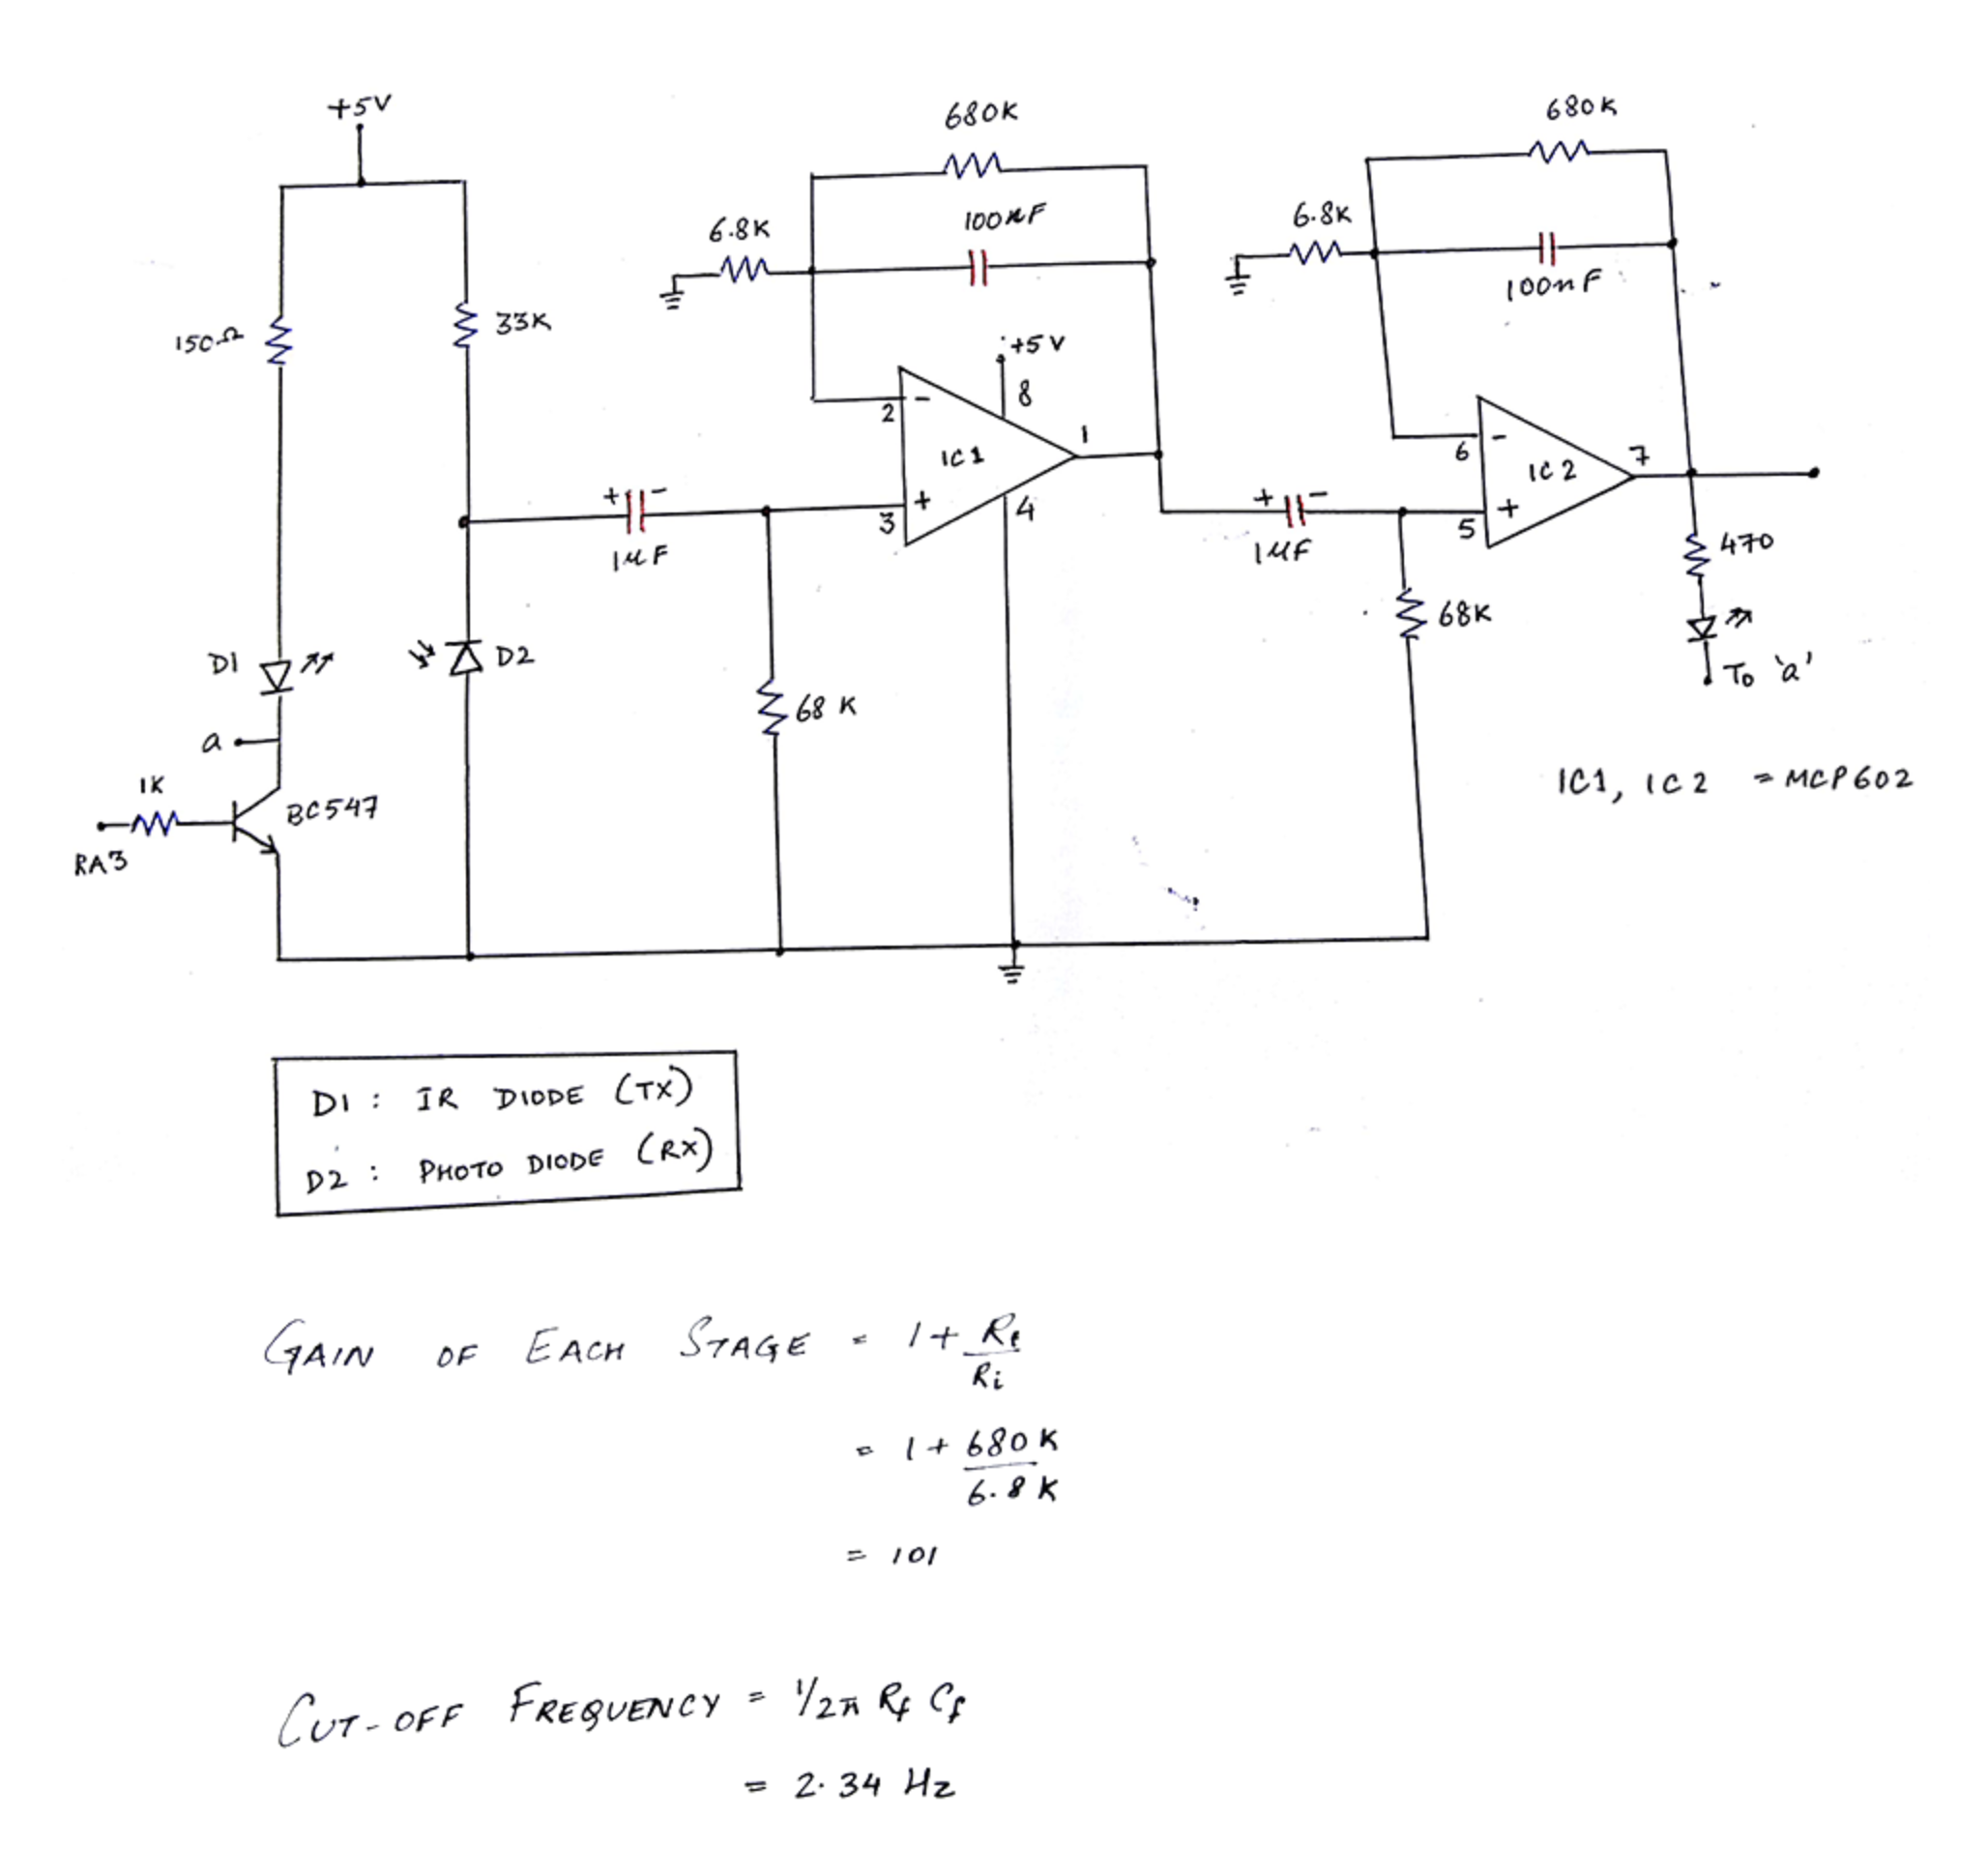
A 1 µF input capacitor at each amplifier stage blocks the DC component, preserving the changing signal.
FILTER AND AMPLIFY
Work in two stages.
Two operational-amplifier stages act as active low-pass filters. My write-up describes about 100× gain per stage, or roughly 10,000× overall, with the aim of producing a logic-level pulse.
MAKE THE OUTPUT VISIBLE
Add a simple indicator.
An output LED was intended to blink with detected pulses, making the circuit’s response visible.
NOTEWhat the circuit numbers do, and don’t, establish.
My write-up rounds the cutoff to about 2.5 Hz, or 150 beats per minute; the handwritten calculation gives 2.34 Hz and 101 gain per stage.
I have kept both: nominal design calculations, not measured accuracy or a validated detection range for SVT.
04 / FROM DRAWING TO OBJECT
Off the page.
Onto the workbench.
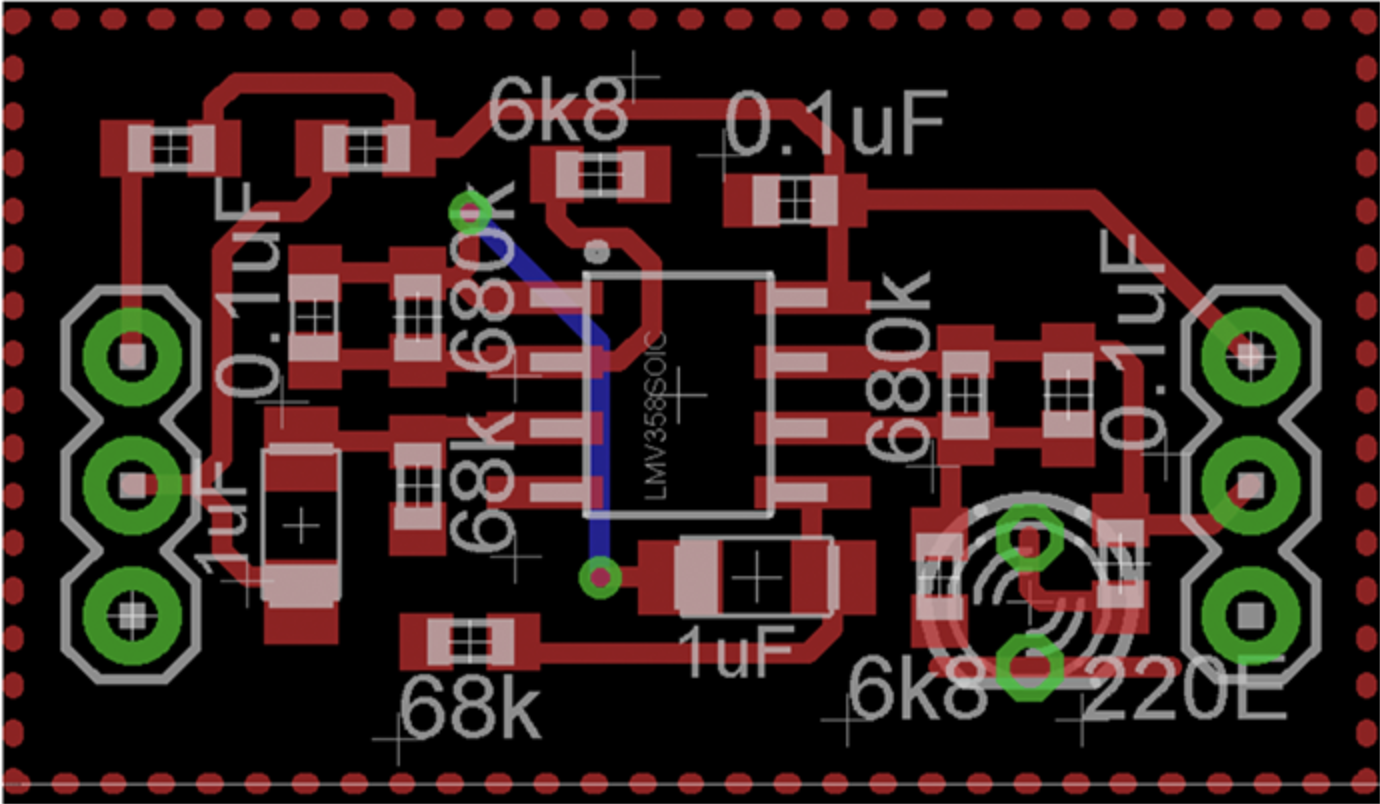
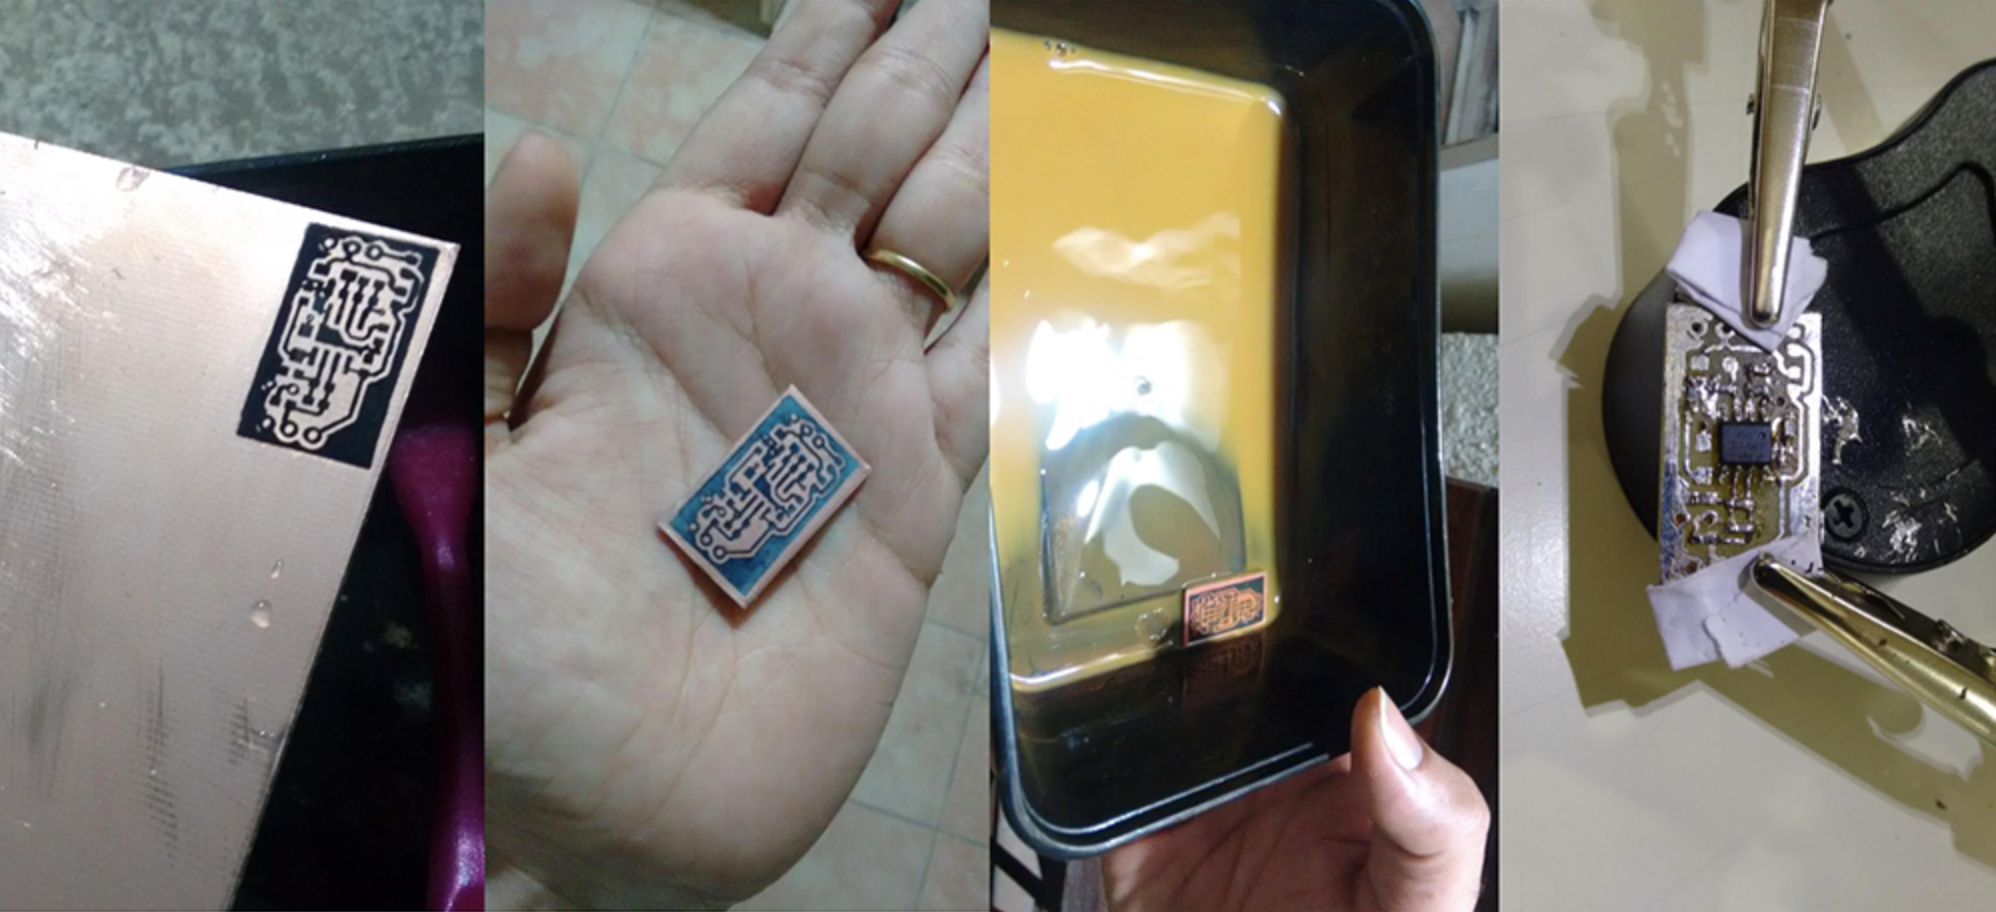
The project moved through a breadboard, an EAGLE schematic and PCB layout, then into a hand-made board. These are the original artifacts from that process.
01 / BREADBOARD
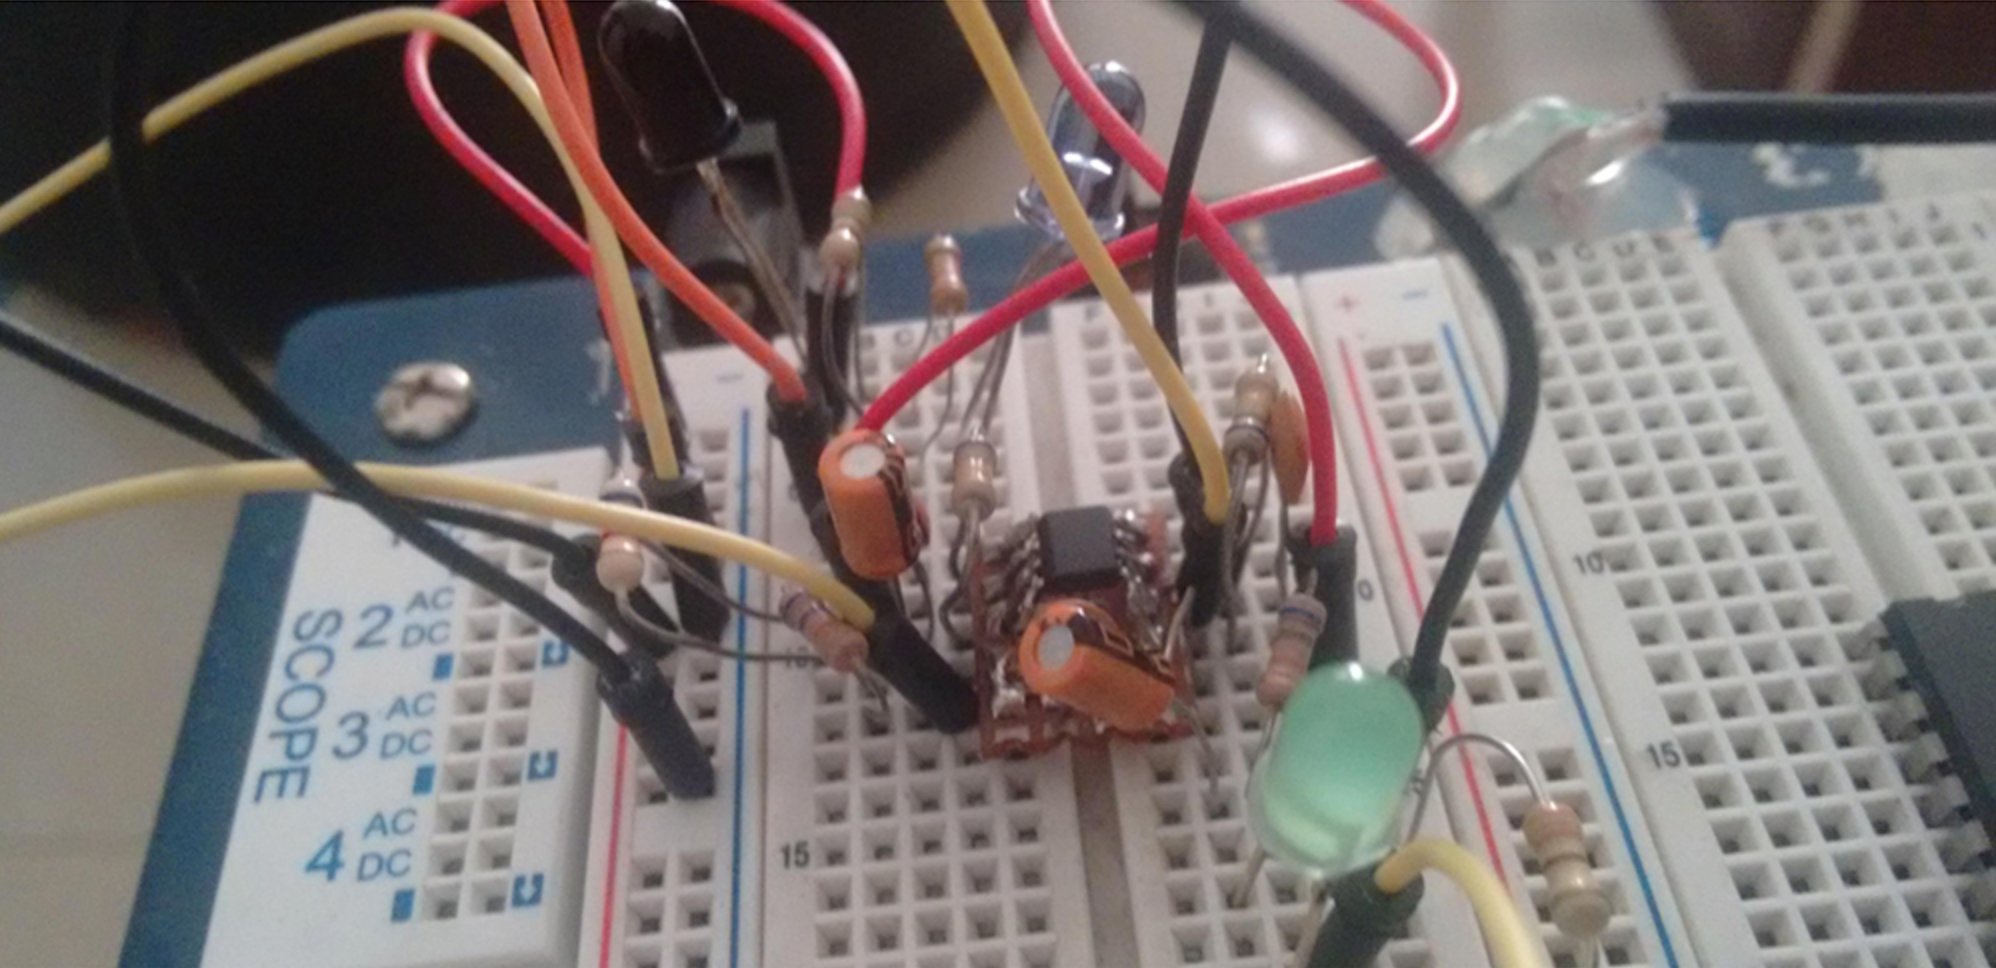
Start with connections I could change.
I assembled the circuit on a breadboard before committing to a PCB. The photograph shows the amplifier, capacitors, wiring and indicator LED.
02 / SCHEMATIC TO PCB
Give the circuit a place to live.
I drew the schematic and the printed circuit board layout in EAGLE. The first describes the electrical connections; the second gives those connections a physical arrangement.
The hand drawing labels the amplifier MCP602; EAGLE labels it LMV358. These artifacts are not a reconciled build specification.
03 / FABRICATION
Turn the layout into something I could hold.
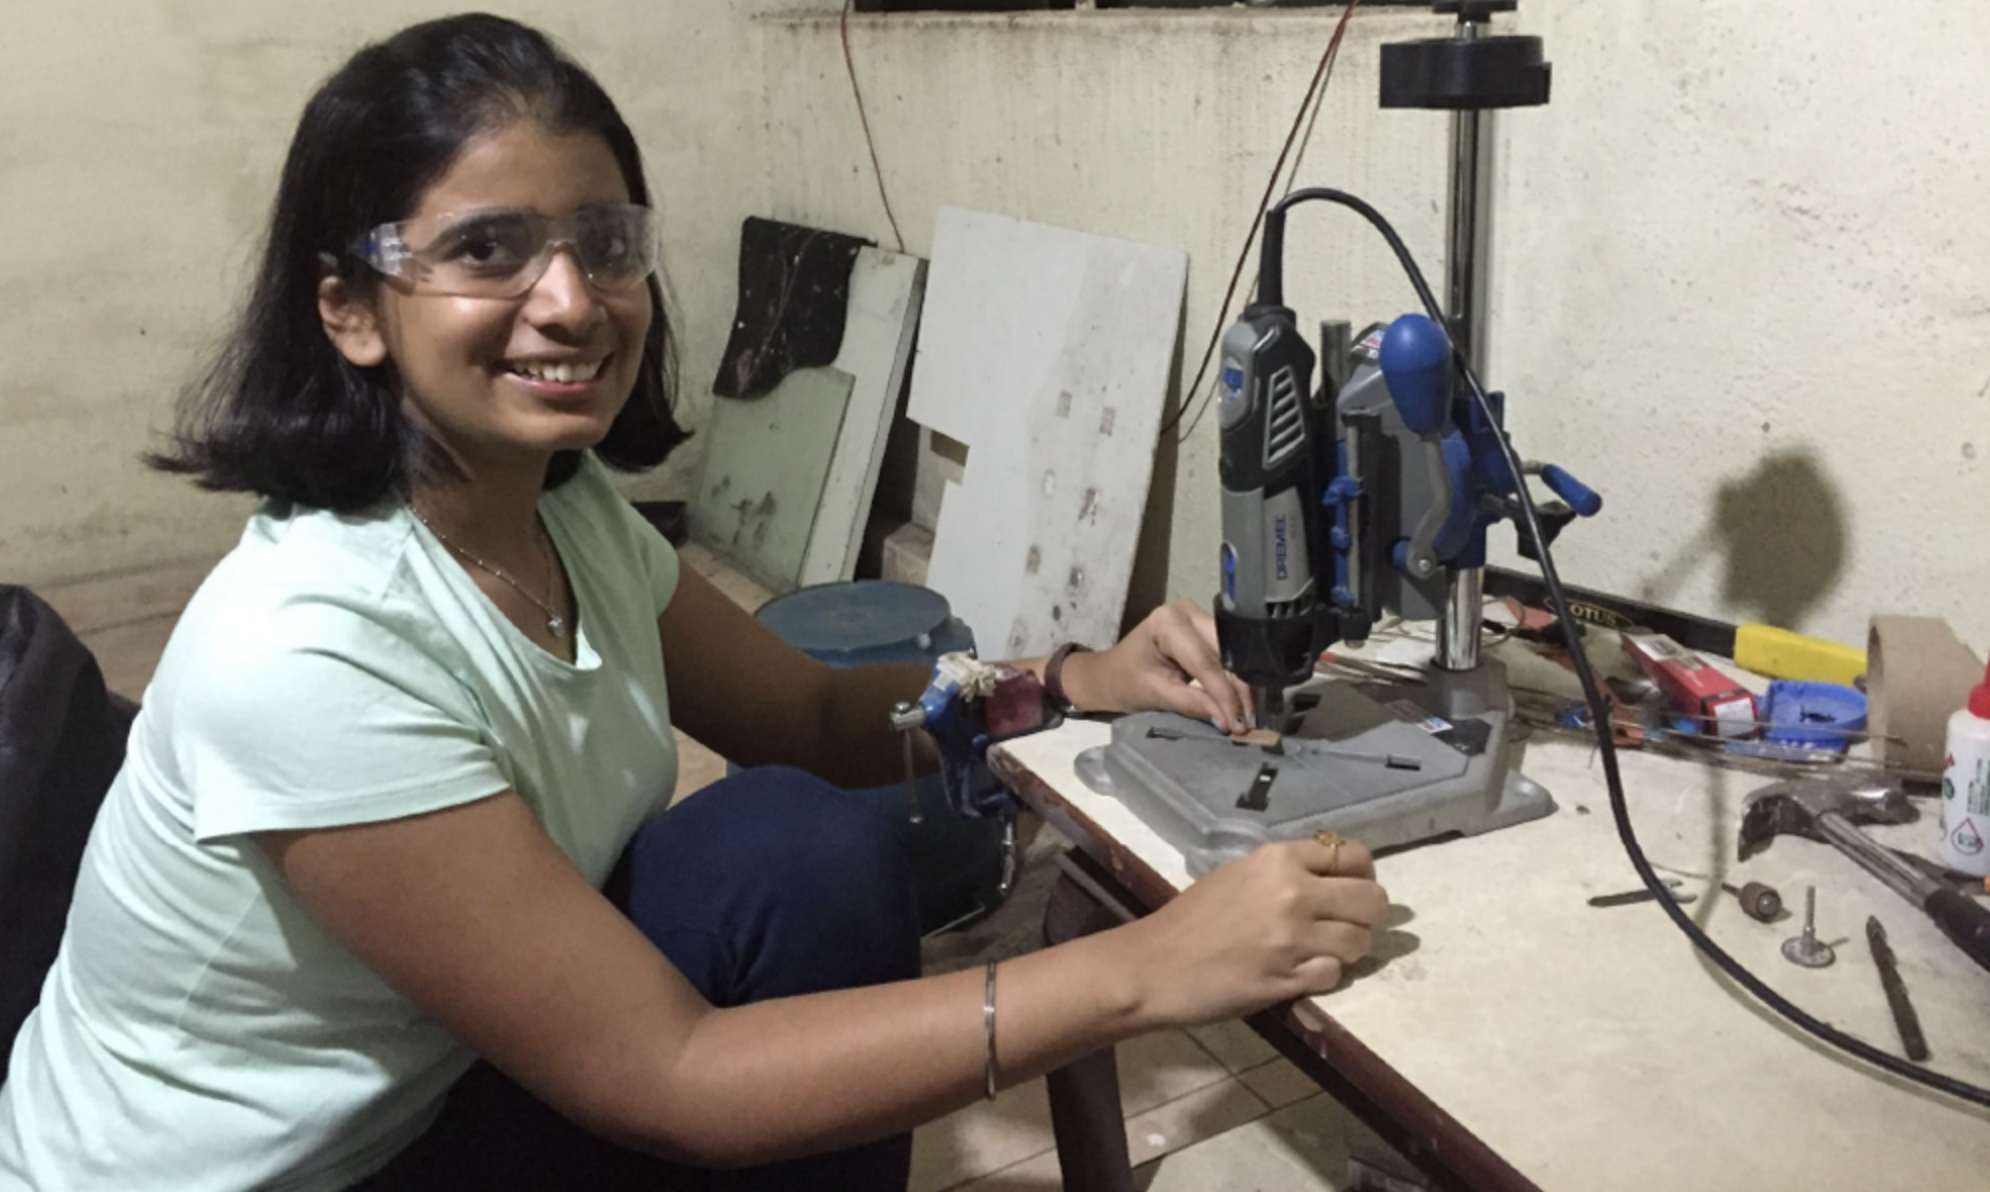
Transferring the trace pattern, etching, drilling and soldering turned the layout into a small physical board.
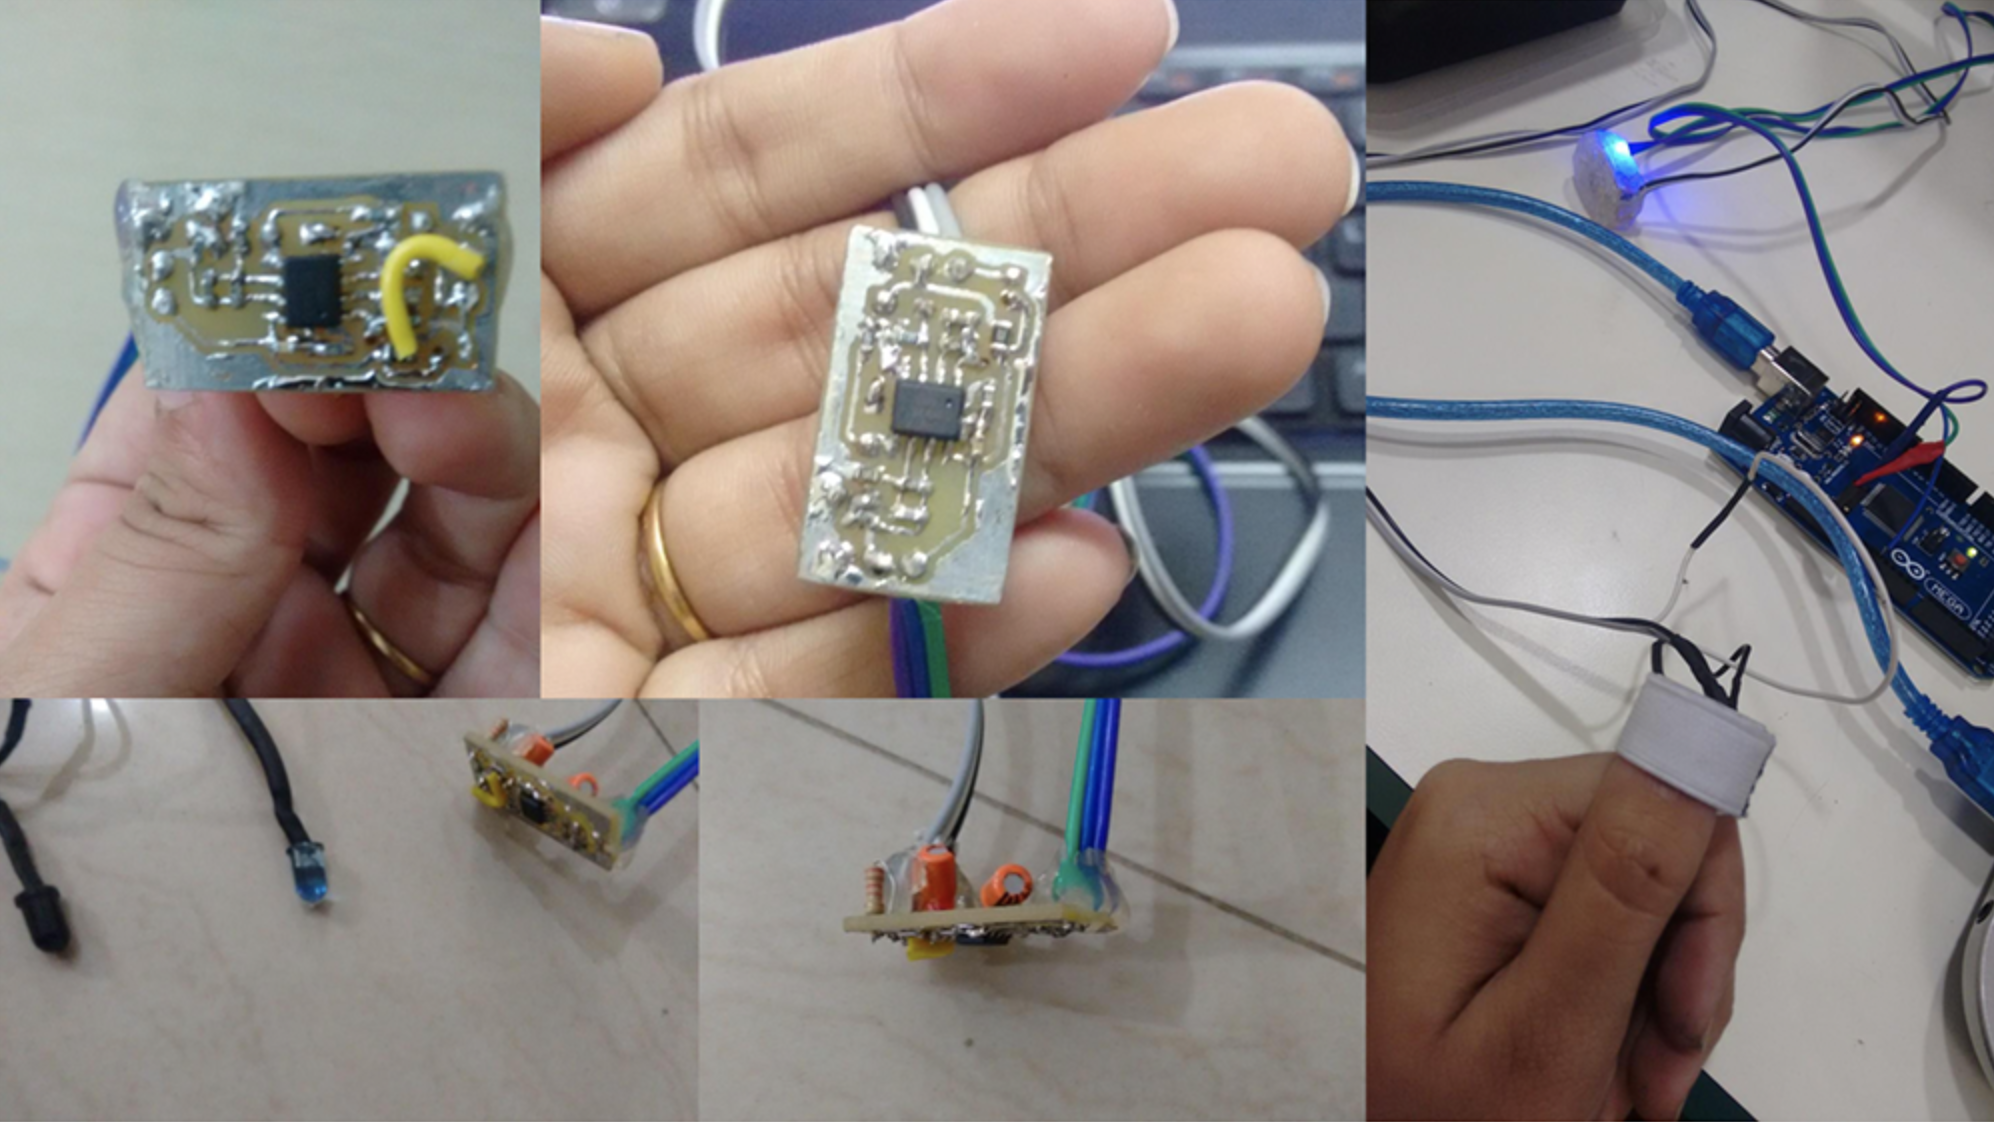
04 / PHYSICAL PROTOTYPE
Bring it back to the fingertip.
The final photographs bring together the populated board, sensor components, wiring, fingertip attachment and Arduino connection.
05 / WHAT I TAKE FROM IT
Making a sensor
is not the same as
earning trust.
A personal question became a physical exploration.
I wanted checking my pulse to ask less of me. That question took me from optical sensing to an Arduino-connected prototype.
Looking back, I would separate two questions: could I build a way to sense a pulse, and what would it take to trust the readings? This project is my exploration of the first.
The second question is still open.
The record contains no comparative accuracy, clinical validation, sustained-use results or demonstration of the intended daily summaries.
I cannot claim this replaced manual checks or a Fitbit, or could detect or manage SVT. Next, I would compare against a reference and test movement, contact and day-long comfort.
The aim was less effort. The responsibility was not to ask for more trust than the work could support.
This story draws on my original project write-up, diagrams and photographs, with the personal motivation added here. The original does not record project dates, collaborators or a formal results section.
Read the original project documentationKEEP EXPLORING